Understanding the Job Monitoring Dashboard: Job Processing Center
The Job Processing Centre provides a detailed view of all jobs processed from the Job Queue, categorized separately as Documents and Emails.
- Separate Job Types: Both Documents and Emails are displayed distinctly, helping users assess each communication type's performance.
- Download Option:
- For jobs pushed via Live Upload or Draft Upload, users can download output files directly from this interface.
- For API-triggered jobs, the files will proceed through additional stages such as approval or printing workflows.
Clicking the Job Processing Centre card gives access to in-depth metrics and tools to assess processing status:
1. Failure Stats (Left Panel)
A pie chart presents a visual breakdown of:
- Successfully processed documents/emails
- Failed documents/emails
 Note: Click the "Success/Failure" section of the chart to auto-filter and display the corresponding records in the table on the right.
2. Language Stats (Left Panel)
The Language Stats section provides a horizontal bar graph view of:
- Number of items processed successfully by language
- Number of failures per language
This helps identify any language-specific issues during job generation.
3. Document/Email Table (Right Panel)
This dynamic table displays job-level data with the following default columns:
- Unique ID
- Unique Name
- Status
- Payload
- Generated PDF
Users can customize the view by enabling additional columns via the three-dot menu:
- Language
- Number of Pages
- Time of Creation
- Reason for Failure
How to View Failure Reasons:
Click the three-dot icon above the data table to open column options.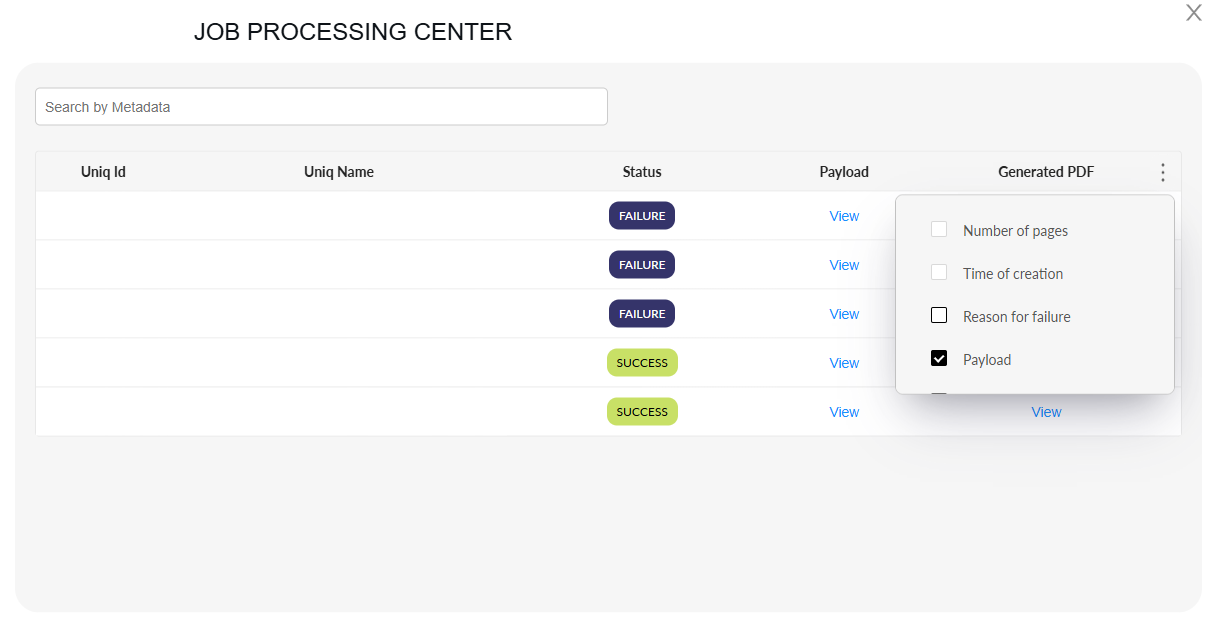
Enable "Reason for Failure" by selecting it from the list.
Locate the failed record and click the eye icon in the respective row.
A modal window will appear showing the exact reason the document/email failed to process.
Filtering and Search Options:
At the top of the table, users can filter jobs using metadata such as:
- Unique ID
- Unique Name
- Language
- Status
Additionally, users can view the generated PDF by clicking the 'View' button, which opens the corresponding PDF in a new window for easy access.
Related Articles
Understanding the Job Monitoring Dashboard: What is Printing Center and Control Center?
Printing Center: The Printing Center allows users to track and review all documents that have been successfully printed. Unlike the Printing Engine, which displays jobs queued for printing, the Printing Center focuses on completed print jobs. Here’s ...Understanding the Job Monitoring Dashboard: What is Approval Engine?
The Approval Engine in Perfect Doc Studio is the module where jobs are reviewed and approved prior to printing. This process is applicable only when jobs are submitted through external APIs (e.g., Postman) with the approval flag enabled. How It Works ...Understanding the Job Monitoring Dashboard: Job Queue
Job Queue The Job Queue in Perfect Doc Studio displays a real-time count of all submitted jobs (documents and emails) triggered via Live Upload, Draft Upload, or API. As jobs move through the system, this live counter decreases until all items are ...What is Job Monitoring?
What is Job Monitoring? Job Monitoring in Perfect Doc Studio provides a centralized dashboard to oversee all jobs (document generation & email delivery.) It allows users to stay informed about the progress, status, and outcomes of submitted jobs in ...Understanding the Job Monitoring Dashboard: What is Printing Dashboard?
After a batch of jobs is approved in the Approval Engine, the Send for Printing button becomes available, prompting the user to move the jobs to the Printing Engine. Clicking this button opens the Printing Dashboard. How to Exclude Documents from ...